
Economy
The Expansion is Dead, Long Live the Expansion

April 30, 2020 | By Christopher Thornberg, PhD
As Beacon Economics has written in our published outlooks over the past six weeks, a true understanding of what is currently happening in the economy is limited given the delay in receiving relevant data, as well as the total lack of recent historical examples illustrating how pandemics impact economies. As such, any prediction of how the COVID-19 crisis will affect the economy over the next year should be presented with the utmost humility—advice that the vast majority of forecasters seem to be ignoring in their increasingly hyperbolic predictions of economic collapse.
It simply isn’t that clear. While we appreciate that the numbers on jobs and economic activity are grim, they are not being driven by true, structural economic problems, but rather public health mandates. Once the mandates are lifted, there is no reason to assume that things won’t quickly get back to normal. The depth and degree of the economic damage will be determined by the five questions detailed in our recent outlook. We believe that true, long-term damage will be minimal, and we anticipate a strong rebound in the second half of the year (a “V” type business cycle).
This week, the first estimate for first quarter GDP growth was released—and it isn’t pretty. The economy contracted at a 4.8% pace, driven by a very sharp decline in real consumer spending. This is not as bad as it sounds, since (as always) growth is presented in annualized form. In real terms, it means that economic activity contracted by about 1.2% from the fourth quarter of 2019 to first quarter of 2020, driven by a less than 2% decline in spending. But it still represents the third worst showing for the economy in over three decades and worse than what Beacon Economics anticipated. This means, almost assuredly, that the record long economic expansion that began way back in July of 2009 will be officially declared over as of February of this year—whenever the National Bureau of Economic Research gets around to officially dating the cycle.

It’s easy to look at the first quarter GDP number and assume it confirms much of the negative rhetoric that has been dominating headlines. But digging into the data actually suggests a more positive story. As such, Beacon Economics is sticking with our outlook for the post-virus U.S. economy: a sharp downturn where the record negative number we will surely see in the second quarter (the estimate will be released in late July) is followed by a record positive number in the third quarter as the economy surges towards a more normal level of output.
One bit of good news comes from the sources of contraction in the first quarter. We correctly predited that the decline in spending would negatively impact the travel, food, recreation, and auto industries, but these hits were not large enough to explain the full pullback in consumer spending last quarter. Digging more deeply into the spending data, it’s evident that the largest pullback in the economy—one that explains nearly half the decline in first quarter economic output—is, paradoxically, health care.

The recent decline in spending is being driven largely by the industry’s decision to put all but medically necessary procedures on hold, both to create capacity for the expected surge in virus-related demand as well as to avoid the close mixing of patients with COVID-19 and those seeking other sorts of medical assistance. We had anticipated that accelerated health care spending driven by the need to care for those who contracted and became ill from COVID-19 would offset this decline. It clearly didn’t.
The decline in health care spending, however, is actually good news for two reasons. First, it presents clear evidence that the health mandates are working. Outside of New York and Seattle, there have been almost no hospitals that have struggled with excessive demand from those needing medical care due to complications from COVID-19. And with the number of new cases declining, for now it appears that the industry will not have to worry about the ability to manage demand.
The second reason the decline in spending is positive news is related to the intentional decision to defer non-emergency care. The sharp pullback in health care spending is truly unique. This sector has been growing consistently for decades and has largely been immune to the business cycle; there were no declines in health care spending throughout the Great Recession. Much of the industry is funded only indirectly through consumers with other payments and funding coming through insurance or the government. Medical procedures are not something most people skip altogether or permanently. All those delayed teeth cleanings, eye appointments, and other health procedures will happen, just later in the year. This supports the “V” outlook, with a surge in health spending as people catch up on basic needs. It is also worth noting that the easing of restrictions in California is beginning with health services, which will help second quarter numbers.
 Another bit of good news comes from the income numbers. Many workers and business owners are suffering from lost income—losses that will constrain their ability to spend after the health mandates are lifted (one reason those predicting a “U” are calling for a slow, delayed recovery). But many other workers are not experiencing the same degree of income impairment and are instead being denied the ability to spend their income due to the shutdowns. This will lead to increased savings among these households and pent up demand. If the second effect is greater than the first, on net, it will generate excess spending in the second half of the year.
The March savings rate—when the restrictions went into place—leaped to 13.1%, the highest in decades. At least for now, pent up demand in the form of unspent income is clearly greater than lost income among those who have been economically affected, again supporting the “V” recovery theory. April numbers, however, may be more telling because the income hit may be lagging. Clearly, there is still a long way to go and a lot of uncertainty related to the overall path of the virus and the mandates that are causing harm to the economy, but Beacon Economics continues to believe that as far as recessions go, this will be a dramatic but short lived one.
source https://beaconecon.com/blog/the_expansion_is_dead_long_live_the_expansion_4_30_2020/


Coming October 5th
Economic Horizon 2024: What Lies Ahead?
The Inland Empire Regional Chamber of Commerce, in collaboration with Beacon Economics and the County of San Bernardino, is thrilled to announce that the anticipated economic forecast conference, Economic Horizon 2024: What Lies Ahead, Inland Empire? will be held October 5th from 3:30 PM to 6:30 PM at the El Prado Golf Courses in the vibrant city of Chino, California.
Esteemed economist, Dr. Christopher Thornberg will present complete outlooks for the U.S., California, and Inland Empire economies. “The Inland Empire stands at the crossroads of remarkable economic opportunities and challenges,” said Thornberg. “I’m excited to unpack the trends and shifts that will define the region’s economic landscape in the next year, and beyond.”
Known for his razor-sharp observations, and fun, energized delivery, Thornberg’s presentation will include pointed discussions about inflation, the Fed’s next move, housing markets, strengths and instabilities in the economy, and what current trends mean for the nation, state, and local region.
The conference will also be graced by the insights of California State Treasurer Fiona Ma as keynote speaker. In her words, “The strength of California’s economy is deeply interwoven with the growth trajectories of its regions. The Inland Empire, with its dynamism and resilience, is a testament to this synergy. I am honored to join ‘Economic Horizon 2024’ and share a vision where policies, partnerships, and potentials converge to elevate the Inland Empire to unprecedented economic heights.”
“This conference is a testament to the collaborative spirit of the Inland Empire and our commitment to fostering a robust, resilient economy,” said Edward Ornelas, Jr., President of the Inland Empire Regional Chamber of Commerce. “Our partnership with Beacon Economics and the County of San Bernardino aims to offer a platform for profound economic discussion, forecasting, and strategic future planning.”
Attendees can anticipate not only expert insights into the economy but also networking opportunities and a chance to connect with key business, government, and nonprofit leaders from across the region.
Full event details are available at: economy.iechamber.org
In arguing that there will be no near-term recession, Beacon Economics has been an outlier in the forecasting community.
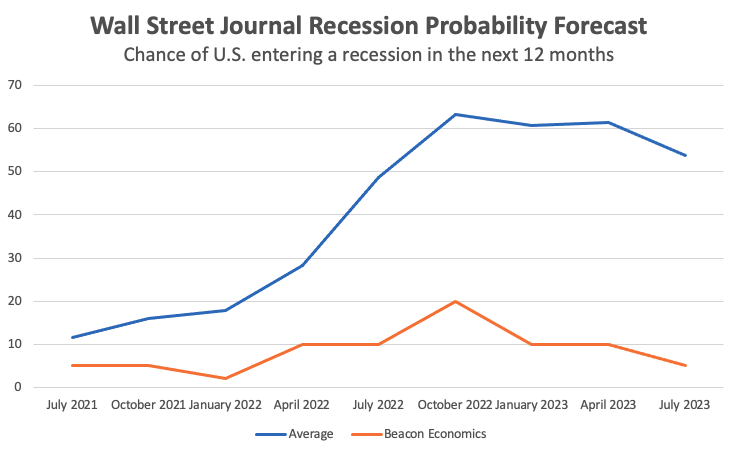
Much to the chagrin of those who have been predicting otherwise, the U.S. economy has stubbornly continued to grow—and 2023 is shaping up to be a better year than 2022. Beacon Economics has argued all along that there is little reason to think we are heading for a near-term recession (outside of our worries about the potential impact of Fed policy). It seems as if our optimism is starting to spread. The Economist recently published an article titled Could America’s Economy Escape Recession?, the latest Wall Street Journal recession probability survey (which we contribute to) shows that economists’ expectations of a recession are starting to fade, and Bank of America became the first major forecast group to retract their recession call.
Beacon Economics recession probability rose only slightly in 2022, and our current estimate of a recession occurring in the next 12 months is at 5%, making us an outlier in the forecast community (take a look at the Journal’s survey and you’ll see what we mean). This isn’t to say that we don’t recognize signs of stress in the economy driven by higher interest rates and the recent bout of inflation. Rather, we’ve never viewed these issues as rising to the level of being systemic given that they were caused by the same thing that has kept consumer spending supercharged—the excessive stimulus thrown at the economy during the pandemic.
The greatest risk, as we have seen it, was always the undue tightening by the Federal Reserve, which was implemented in response their original sin of excessive loosening. But the nation has fared even better throughout the large interest rate increases than we thought it would. Now, with inflation cooling, the Fed seems likely to slow their credit tightening efforts, so even this concern is fading.
Admittedly, it is affirming to see our optimism playing out in the trends. But what should we make of this big miss by the broader forecasting community? Paul Krugman, in a recent New York Times column, had one answer—forecasters (at least in the aggregate) just aren’t very good at forecasting recessions. He notes that studies of the history of recession predictions show the forecasting community to be remarkably inaccurate—calling for recessions when they don’t occur, and largely failing to predict them when they do. So much for the wisdom of the crowds. But what Krugman never addresses is the ‘why’. Are forecasters just dumb? As John Kenneth Galbraith famously quipped “[t]he only function of economic forecasting is to make astrology look respectable.” Or is there something else going on?
It might seem surprising that forecasters haven’t learned how to predict recessions better, given the technical tools that have been developed over the past 50 years. The first macroeconomic computer model was built by U-Penn’s WEFA group back in the early 1970’s, winning the group’s leader, Lawrence Klein, a Nobel Prize. Today’s economists have far more computing power at their disposal, not to mention a broader set of quality data to play with. Yet, in the aggregate, forecasters still seem unable to see the arrival of the economic tempest until it is already upon us.
The issue with these big macro models is that they are primarily designed to calculate economic trends on the basis of a complex statistical estimate of covariances found within the historical data. Such models rely on each expansion being similar enough to the previous one that these covariances remain relevant. However, recessions are—by definition—a period when the economy deviates substantially from trend. As such, these sorts of forecast models simply don’t have the capacity to predict a recession, unless the forecaster specifically programs it in.
Those seeking to predict oncoming recessions often look for other sets of statistical leading indicators that can foretell when such a break from the trend could occur. In short, they look for historic patterns of data that seem to correlate with oncoming recessions. As it turns out, there are very few of these kinds of guideposts in the data—something that does not surprise us as we’ll explain in a moment. The one data point that does highly correlate with future recessions—and the one that is surely behind the so-far incorrect call of recession by the forecasting community at large—is the inverted yield curve (The yield curve is the difference between short and long run interest rates. In the past, when short run rates are higher than long run rates, we say the curve is inverted). This statistic does indeed have a good track record, with the five recessions prior to the COVID-19 pandemic all preceded by a negative yield curve. Hence, in July 2022 when the yield curve went negative, many forecasters viewed a recession as fait accompli. Yet, as always, conflating correlation with causation is liable to lead to bad calls.
Beacon Economics noted the inverted yield curve last year, but we did not view it as sufficient or even necessary evidence to predict an economic downturn (We can proudly state that the only two times Beacon Economics has predicted a recession was back in 2006 at the firm’s inception – I left the UCLA Anderson Forecast in 2006 to found Beacon in large part because I thought the real estate bubble would cause a recession upon its collapse, a point of view not welcomed by the UCLA Forecast’s director – and in March 2020 when it became obvious the pandemic had spread globally). More broadly, we do not believe that there is any recession-predicting “magic bullet” to be found in the data—yield curve or otherwise. To understand our view, start with the recognition that recessions are created by rapid changes in the structure of aggregate demand in an economy. The speed of change is faster than factors of production can be redeployed within that economy. The net result is an overall decline in output and an increase in slack resources—a recession. From this vantage point, predicting a recession means predicting the rapid change in aggregate demand. The key to understanding why there is no clear set of recession leading indicators is recognizing that the sources of recessions are highly varied.
Not unlike Tolstoy’s happy and unhappy families, while every expansion is similar to previous ones (this is the reason VAR models are good at predicting trends), every recession is liable to be significantly different from previous ones. There is a broad range of potential causes behind a rapid change in aggregate demand, from various forms of financial bubbles that will eventually pop, to bad government policy choices, to truly random events like global pandemics. Each type of recession driver has its own specific set of leading indicators compared to others. Add the additional facet that people are unlikely to make the same set of bad decisions that led to some economic calamity in the past, making it even less likely that two recessions will have similar leading statistical patterns (This is a version of the Lucas critique, which says once we make a big mistake we are unlikely to do it again, as we should have learned better. This implies that, statistically, the chance of back-to-back recessions looking the same is less than pure probability would suggest). Thus, relying on simplistic indicators will inevitably lead forecasters astray.
To appreciate this issue in the extreme, consider a situation where there can be no true leading indicators. In March 2020 when COVID-19 was spreading rapidly through the United States, it became clear that governments would be enacting strict public health measures to control the spread of the malady, and that these efforts were going to close a large portion of the service sector. It was pretty obvious that the U.S. economy was going to experience a recession, since this is exactly the type of rapid change in aggregate demand that drives recessions. But given the sheer randomness of the emergence of viral pandemics, there simply can be no economic leading indicator.
Of course, most recessions don’t begin so arbitrarily. In 2006 Beacon Economics was the first West Coast forecast to predict what eventually became known as the ‘Great Recession’, a destructive downturn that started in the 1st quarter of 2008. The roots of that recession were manmade in the form of a massive subprime consumer lending surge that started in 2003 and vastly overheated both the housing market and consumer spending. By 2006 it was clear that these imbalances had moved way past the point of no return and the economy would necessarily experience a recession—driven by rapid declines in the housing supply and consumer spending—once the sub-prime bubble inevitably collapsed in on itself. The imbalances were the leading indicators. Yet, we know that these imbalances were different than the ones that led to the tech downturn in 2000 (a stock market bubble combined with excessive business investment) or the 1991 downturn, which was driven by excesses in bank lending and commercial investments.
What all three of these recessions did have in common was the inverted yield curve, including in 2006 when Beacon Economics made its early call of the Great Recession. Ironically, at that time forecasters were more skeptical of this statistical bad omen. One article written at the time from U-Penn, home of the legendary WEFA model, stated that the inverted yield curve “… gave shudders to those who see the phenomenon as a harbinger of recession. And yet, the U.S. economy is strong, and surveys show most forecasters think it will stay that way.” In the first half of 2007 the Wall Street Journal recession probability survey was running 25%, as opposed to the 60% level during the first half of 2023.
Perhaps it was their bad call in 2006/7 that made more forecasters believe the yield curve indicator. Why hasn’t it worked for the current recession predictions? Inverted yield curves are primarily generated by the Fed’s choice to push up short-term interest rates. Back in 2006, short-run rates were pushed higher because the Fed was worried about consumer lending and the housing market. In the 2000 downturn in it was because the Fed was worried about the tech stock bubble. In these cases, the inverted yield curve can be thought of as nothing more than skid marks up to the edge of a cliff, created by a driver who realizes, belatedly, of the approaching danger. In contrast, in 2022, short-run rates were raised because the Fed was worried about inflation. But inflation by itself has never caused a recession. And as for the rest of the U.S. economy, there are no major imbalances as there were in 2006 or 2000. The link between the inverted yield curve and a true recession-causing imbalance in the economy wasn’t there this time.
But there is a deeper issue at play. The types of imbalances that ultimately end up collapsing, and cause recessions, are typically driven by narratives that, at least in hindsight, are clearly false. The tech bubble was driven by the “New Economy” narrative, while the Great Recession was driven by Wall Street’s magical alchemy that pretended to convert subprime debt into safe investments. Nobel Prize winning economist Robert Shiller notes in his book Irrational Exuberance “[h]ow errors of human judgment can infect even the smartest people, thanks to overconfidence, lack of attention to details, and excessive trust in the judgments of others, stemming from a failure to understand that others are not making independent judgments but are themselves following still others—the blind leading the blind.”
The fact is forecasters are human and just as likely as anyone to be swept up in a collective madness of broken narratives. William Bernstein, in his recent book The Delusions of Crowds, writes that the author of one of the earliest analyses of recession-causing bubbles, Charles Mackay, largely failed to recognize the bubble he was living in while writing his book. Mackay’s missive, Extraordinary Popular Delusions and The Madness of Crowds, was first issued in 1841 and examined the South Sea and Mississippi bubbles that had rocked the British and French two decades prior. Yet, he failed to see the crazed trading surrounding railroads that ended up causing massive damage to the British economy in the Panic of 1847.
One could suggest that if a narrative can actually cause a recession, it has to have the capacity to sway forecasters. But such a claim may be justifiably called self-aggrandizing, as it relies on forecasters actually having social and political clout. But, given what we have suggested above, this may well be by definition. In such a world, we have to rely on Warren Buffet’s famous line to be “fearful when others are greedy, and greedy when others are fearful.”
Ultimately, recession forecasts can only be created through a complex interaction of theory and data to identify when and where economic trends become so disengaged from normality as to ensure a recession when the process does eventually begin. Of course, such a determination is full of nuance and subtlety. Beacon Economics made the right call in 2006 because the signs of excess were, at least in our estimation, glaring. We made the right call in 2022 because there were few signs of such excess. We haven’t yet been tested by a less obvious situation. As the disclaimer goes, past results are no guarantee of future returns! Forecasting truly is an art. But I still believe we have a leg up by always keeping in mind not just what the data can tell us, but also what it can’t.

#bizzbuzz
Inspired by the Board of Supervisors’ commitment to meet the needs of employers and jobseekers and foster a vibrant local economy, the San Bernardino County Workforce Development Department has been honored with eight 2023 Achievement Awards from the National Association of Counties (NACo).
Among the services and initiatives for which WDB was honored were the Rapid Response Community Resource Fair, Economic Recovery Business Outreach Program and, in partnership with the Public Defender’s office, the Record Clearing, Resource and Employment Fairs.
Thanks to strong and stable leadership and policy direction from Board of Supervisors Chair Dawn Rowe and her colleagues on the Board of Supervisors, San Bernardino County received a record-breaking 160 NACo awards this year. The awards reflect the Board’s efforts to cultivate the innovation that leads to the development of outstanding public service programs.
The NACo awards recognize the best of the best among county governments across the U.S. Nationwide, 40,000 county elected officials and 3.6 million county employees provide important services, such as caring for our physical and mental health, maintaining roads, ensuring public safety, strengthening environmental stewardship, administering elections and much more.
“The Workforce Development programs and services recognized by NACo highlight the extraordinary work being done by Workforce Development to enhance career opportunities for our residents and help businesses grow,” Rowe said.
The first Rapid Response Community Resource Fair was developed shortly after United Furniture Industries (UFI) abruptly laid off more 300 employees in the High Desert without advance notice just days before Thanksgiving 2022. When Workforce Development was alerted, staff quickly mobilized businesses and community partners to help connect those laid off to available employment opportunities, as well as various other community resources. Approximately 275 of the affected UFI employees were offered new employment opportunities as a result.
The Economic Recovery Business Outreach Program was a pilot program that tapped into the wide-reaching business network of chambers of commerce. This collaboration between WDB and various chambers of commerce throughout the county was designed to leverage the relationship between chambers and small businesses to build awareness and accessibility to Workforce Development services available to them. Outcomes as a result of this partnership include various successful services including job listings, job fairs, positions filled, and job training assistance, among others.
Perhaps the most impactful program receiving this recognition is the Record Clearing, Resource and Employment Fairs. Workforce Development and the Public Defender’s Office have partnered with businesses and community organizations to increase economic access and equity. The partnership was designed to bring critical resources directly into the community – to churches, community centers, community colleges, and America’s Job Centers – for those looking to remove barriers and increase their access to employment opportunities and other services. The Public Defender helps participants by providing expungement or record clearing services, and Workforce Development brings employers with job opportunities, all within the same location. The events have been well received and proven useful to the community, making this a long-term partnership, not only between Workforce Development and the Public Defender’s office but a long list of other community organizations that have also participated.
“Our team and board feel fortunate to be recognized for these awards,” said William Sterling, chairman of the Workforce Development Board. “The underlying factor of the programs being recognized are partnerships. We feel fortunate for our staff and the relationships developed with other departments and organizations and the impact these services have had within our communities, which is at the core of what public service is supposed to be.”
|
Business Journal Newsletter
|


-

 Sports Business4 months ago
Ontario Tower Buzzers and IE Chamber to Host Exclusive VIP Reception at New ONT Field
-

 Travel & Tourism3 months ago
Ontario International Airport passenger volumes rose for 4th straight month in March while freight shipments grew by 15%
-

 People On The Move4 months ago
Kaiser Permanente Appoints New Senior Vice President and Area Manager for San Bernardino County
-

 Executive Profile5 months ago
Pankow Builders Launches Pankow Wood Structures to Expand Mid-Rise Housing Capabilities
-

 Career & Workplace4 months ago
Jobs Dip, But Not Demand: Inland Empire Economy Shows Mixed Start to 2026
-

 Opinion3 months ago
KTGY Announces Unanimous Approval of Community-Serving Shopping Center in North Redlands, California