
Opinion
UCR Grads Making Smart Home Audio a New Standard
UCR Grads Making Smart Home Audio a New Standard
By Inland Empire Business Journal staff
We live in an increasing world of connectivity, with platforms by Amazon, Google, Apple, or Microsoft. However, these platforms tend to only work within their own ecosystem, locking consumers into a certain set of products. Vanguard Dynamics’ VAIL Cast, integrates the capabilities of Artificial Intelligence to break these limitations and create a smart home audio interface that is user-friendly to everyone, regardless of what platform they use.
Imagine bringing the ambiance of an upscale restaurant home as you dine over classical music and candles with your guests. Cast your favorite music from any mobile device or laptop to any room. At the end of the day, you tell your home to draw down the shades, lock the doors, and shut off the lights while your favorite songs play in your bedroom. All this, and much more, can only be achieved with VAIL Cast.

VAIL Cast Concept
Vanguard Dynamics’ goal is to bridge this gap and develop a product that works with every major platform for your convenience. This creates even greater connectivity, allowing everyone to use their favorite products, no matter their platform preference. It acts as a WiFi booster, so the WiFi signal throughout your home improves. By using it with the platform of your choice, it gives you a smart home experience catered to your liking and still allows you to utilize all the capabilities of any smart assistant. Connect VAIL Cast to a TV and any pair of speakers and enhance the sound of your favorite movies, shows, or video games.
Born and raised in the Inland Empire, Alex Chiou is on a mission to make smart home audio a new standard. Chiou founded Vanguard Dynamics in 2011 and has made a profound impact on the audio industry with award-winning and innovative smart home audio products. His current project, VAIL Cast, is a stereo amplifier that amplifies the sound of a smart assistant throughout your home. It connects with all of today’s most popular smart home digital assistants with Chromecast built-in, works with Alexa, Apple Airplay 2, and Microsoft DLNA and it is the only amplifier that works with all platforms simultaneously.
“We’ve been working with home builders around the world for over a decade and VAIL Cast is a game-changer for them because we’re providing an entertainment system that gives their homes high fidelity sound and strong WiFi coverage in every room that is fully universal and future-proof, controllable by any smart device.”
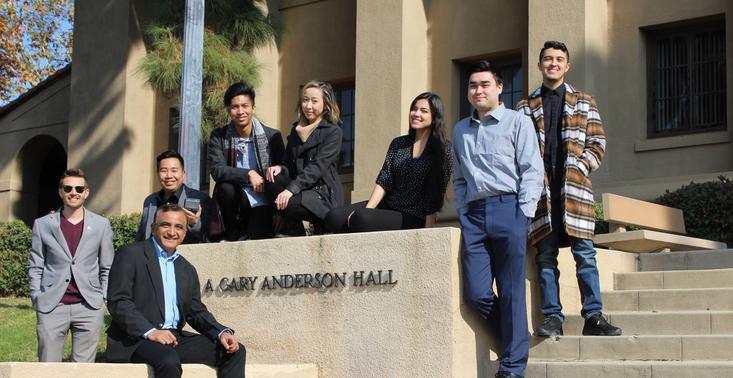
Chiou thought this would be a great opportunity to reconnect with the community of the Inland Empire and has been utilizing resources available by the City of Riverside, such as EPIC, the UCR A. Gary Anderson Graduate School of Management, Riverside ExCITE, and the Economic Development Department to help his company raise awareness for VAIL Cast. He reached out to both Dr. Ashish Sood, AGSM Associate Professor of Marketing, and the Career Development Center to gather a team of bright and driven UCR MBA students to help commercialize the new product.
Vanguard Dynamics is now working with an entire team of MBA students, including Alex Waskul, Eduardo Tellez, Jamie Linares, Lily Luu, and Randy Pimentel. The team meets regularly to strategize and brings cutting edge ideas they learn in various classes to the company. Each member contributes to the company through their unique skill sets. Lily and Randy help with the creative side of marketing the product, utilizing their superb writing and videographic capabilities to bring the vision of the VAIL Cast to life. Eddie, an audio enthusiast, utilizes his customer experience and public relations skills to increase awareness and facilitate interactions with their brand. Alex W. and Jamie combine their product management experience to ensure the team properly implements strategies, efficiently meets goals, and ensures effective brand management
The team has received continual support and guidance from Dr. Ashish Sood, AGSM Associate Professor of Marketing; the AGSM Career Center; Mai Temraz, Blackstone LaunchPad Entrepreneur-in-Residence; and Steve Massa, City of Riverside Economic Development, to ensure the team has all the insight and expertise needed to become successful.
They are now in the early stages of creating a Kickstarter campaign by generating content, designing reward-tiers for backers, and gaining support from their fellow UCR family in order to spread the word of this new innovative amplifier to become the new standard.
Here’s how you can help:
Like and share our Facebook Page: www.facebook.com/vailaudio/
Follow us and share our Instagram: @vailaudio
Support us and subscribe: www.vailaudio.com/kickstarter


Opinion
KTGY Announces Unanimous Approval of Community-Serving Shopping Center in North Redlands, California
KTGY’s design transforms an underutilized site into a neighborhood anchor and showcases Regency Centers’ commitment to the growing residential community
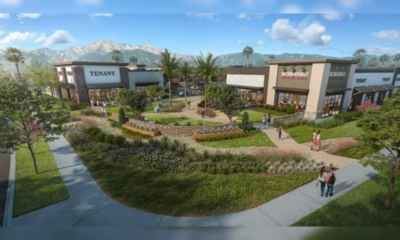
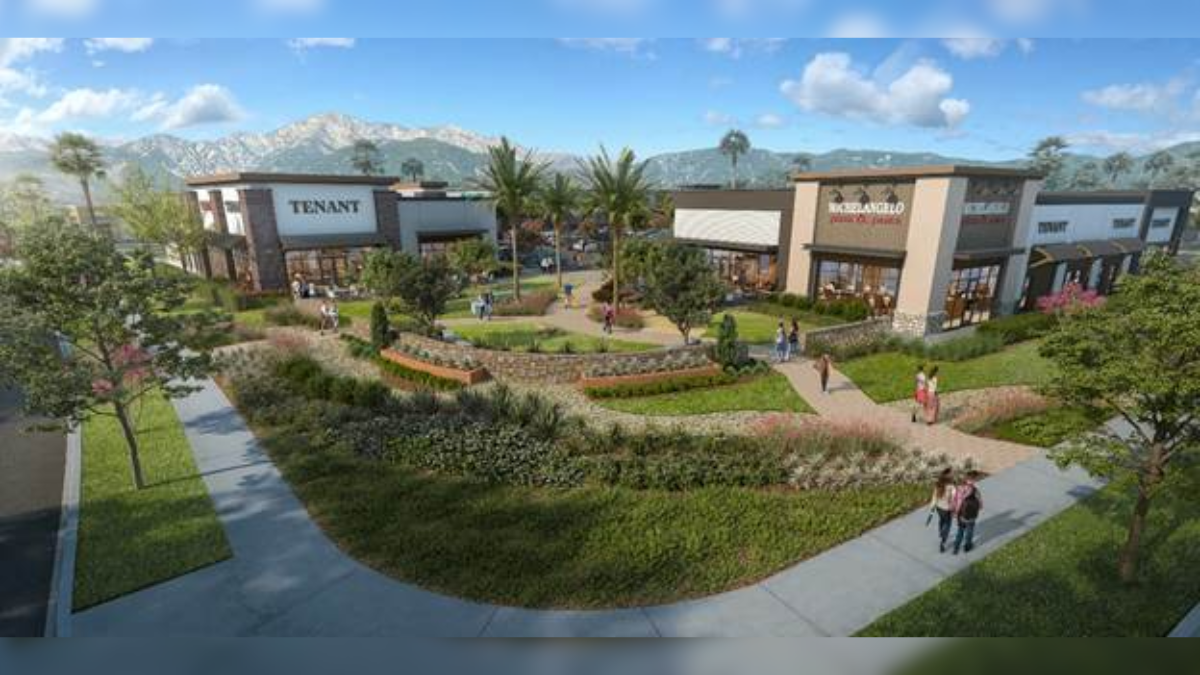
KTGY, an award-winning design firm focused on architecture, interior design, branded environments and urban design, announces that The Marketplace, a Whole Foods-anchored retail development designed for Regency Centers, received unanimous approval from the Redlands City Council on Feb. 17, 2026, clearing the way for the development to move forward to building permits and construction. Planned on an 8.18-acre vacant site at the northeast corner of Lugonia Avenue and Tennessee Street, the center sits in the heart of one of North Redlands’ fastest-growing residential areas.
The Marketplace is planned as a 71,400-square-foot neighborhood retail center anchored by Whole Foods and supported by four shop buildings and a dedicated drive-through pad. Designed to LEED Silver standards, the development reflects Regency Centers’ approach to placemaking, emphasizing retail environments that are authentic to their neighborhoods and foster long-term community connection. KTGY’s design reinforces and complements this vision through context-responsive architecture and a site plan shaped around community needs. The development transforms a long-underutilized site into a neighborhood anchor positioned to serve existing residents and new housing planned to the north and east.
“Working with KTGY and Whole Foods Market on The Marketplace has been a genuinely rewarding process,” said Ray Kayacan, vice president of investments at Regency Centers. “Redlands is a community that’s growing fast, and we’ve been intentional about making sure this development grows with it. Getting unanimous approval from the City Council speaks to the alignment we built with the city early on, and I think it reflects how well the full team executed against a shared vision.”
KTGY’s design team approached the site with the task of balancing client goals, tenant requirements and the needs of a future community while maximizing retail density and flexibility. The site’s proximity to the 210 freeway and its high parking requirements demanded a precise and efficient layout. KTGY allocated the required parking and EV stalls, utilized compact stall allowances and directed truck circulation around the site perimeter. The result is a finely tuned example of suburban retail that serves nearby neighborhoods, attracts customers off the freeway and creates a strong leasing environment for tenants.
The Marketplace is anchored by a 36,000-square-foot Whole Foods and organized around four retail buildings that can be flexibly divided into as many as 18 storefronts. A fifth pad building is planned for a drive-through use with its own dedicated circulation. Early concepts explored a more industrial character, but to secure the grocery anchor, KTGY adapted the development’s aesthetics to align with Whole Foods’ contemporary brand requirements.
The final design features simple, contemporary building forms emphasized by brick columns and tower elements, with a connective brick treatment carried across the center. Roofline and material variations add visual interest, while industrial accents, including gooseneck lamps and standing seam metal awnings, reference the area’s historic context. The architecture incorporates cementitious siding, stone treatments at key corners and parapet-screened rooftop equipment, creating an earthy, warm palette that responds to the surrounding neighborhood.
“Redlands has a real sense of place, and that shaped how we thought about this project from the start,” said Kayacan. “With one major housing development underway and another planned nearby, this site had an obvious gap to fill. Residents are going to have a Whole Foods, flexible retail that can support a range of needs, and a place to gather.”
KTGY also shifted back-of-house functions and truck circulation away from the main parking field, raised the sidewalk and added a landscaped berm to buffer pedestrians from drive-through and freeway activity. A lighter entrance structure at the Whole Foods façade breaks up the flat roofline and creates space for outdoor seating, and the development is rounded out by landscaped buffers and a shaded corner plaza where neighbors can gather.
Buildings are arranged around the perimeter with parking in the center, creating a clear and efficient circulation pattern. The site includes five access points: two primary driveways from Lugonia Avenue and Tennessee Street, secondary entries from both streets and a connection to the Tennessee Village development to the north. The drive-through pad includes its own pocket of parking to support tenant operations.
Two major housing developments — Lugonia Village, with 541 homes, and Tennessee Village, with 460 apartments and commercial space — were approved nearby in 2024, reinforcing the need for neighborhood-serving retail in this corridor.
“Our team approached this site with a focus on maximizing retail density and creating flexible space that can support a range of tenants while meeting the needs of the city, Regency Centers and both existing and future residents,” said Brandon Wernli, associate principal at KTGY. “Balancing a tight site, high parking requirements and a late-stage design shift to meet Whole Foods’ brand standards required precision. The result is a contemporary retail environment that reflects Regency Centers’ commitment to creating neighborhood-serving places that connect with surrounding communities.”
“This development fills a meaningful gap in the built environment,” Wernli said. “With new housing planned nearby, The Marketplace will serve as a neighborhood anchor and a convenient place to shop, dine and gather. It’s a strong example of how thoughtful design can elevate everyday community experiences.”
Construction is expected to begin in late 2026, with completion anticipated in 2028.
Opinion
Ontario International Airport Welcomes Avelo Airlines with New Nonstop Service to Sonoma County

Expansion Connects Southern California Travelers to Northern California’s Premier Wine Destination
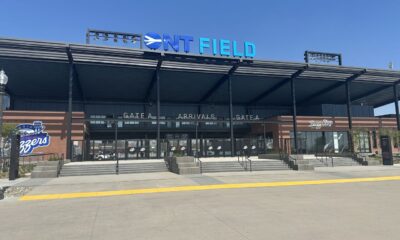
Ontario International Airport (ONT) continues its impressive growth trajectory with the recent announcement from Avelo Airlines about their exclusive nonstop service to Sonoma County and Northern California’s renowned wine country. Starting October 10, the service will operate twice weekly on Thursdays and Sundays, connecting travelers directly to the Charles M. Schulz Sonoma County Airport (STS).
Streamlined Travel Experience
Passengers choosing Ontario International Airport are set to benefit immensely, not just from the expanded destination choices but also from the significant time savings associated with flying out of ONT. Known for its convenience and efficiency, ONT offers a more relaxed and hassle-free travel experience compared to larger, more congested airports. The smaller scale and thoughtful layout of ONT allow passengers to navigate check-ins, security, and boarding processes much more quickly, reducing the stress often associated with air travel.
Local Impact and Convenience
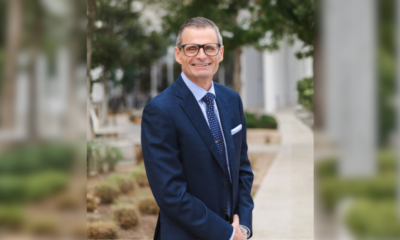
“Atif Elkadi, Chief Executive Officer of the Ontario International Airport Authority, highlighted the benefits of the new service, stating, “We are thrilled to add Avelo Airlines to our family of air carriers as we continue to provide exciting new destinations and travel options for the millions of Southern Californians who have made ONT their airport of choice.”
ONT’s strategic location and accessibility play a crucial role in its popularity. Situated in the heart of Southern California’s Inland Empire, the airport is conveniently reachable for residents from San Bernardino to Riverside and the surrounding suburbs. The airport’s proximity to major freeways reduces travel time to the airport itself, which is a significant advantage for local residents and businesses.
Enhanced Access to Northern California
Andrew Levy, Founder and CEO of Avelo Airlines, expressed enthusiasm about the new route, saying, “We are thrilled to announce our new nonstop service from Ontario to the Bay Area/Sonoma County, offering travelers a convenient, reliable, and affordable way to one of the most beautiful and vibrant regions in Northern California.”
Jon Stout, STS Airport Manager, also noted the mutual benefits of the new connection, “It’s fantastic to see Avelo connect Sonoma County with Ontario. This new route will bring a new level of convenience for our local residents and our neighbors in the Inland Empire.”
ONT’s continued expansion and the addition of new routes like the one to Sonoma County reflect its role as a pivotal hub in the region. With the airport on track to exceed 7 million passengers this year and recent records showing more than 650,000 passengers in June alone, ONT is setting new benchmarks in serving the community.
A Gateway to Growth
With world-class facilities and a commitment to excellent customer service, Ontario International Airport is rapidly becoming the gateway of choice for travelers seeking both domestic and international connections. Elkadi proudly asserts, “With our world-class facilities, great amenities, and unparalleled customer experiences, we are proud to connect the world to one of the most dynamic population and economic centers in the country.”
As ONT continues to expand its services and streamline travel experiences, it solidifies its position not just as a transport hub but as a significant contributor to the economic vitality of the Inland Empire.

“We have to stop touting the minimum wage as a completely harmless policy, or as some kind of remedy for poverty and income inequality… it is neither.”
In the past 18 months, California’s unemployment rate has jumped to the highest in the nation and a new analysis by Beacon Economics suggests that this peculiar increase could be a direct result of the state’s recent minimum wage hikes. Most concerning, according to the report, is that the current unemployment effect is specifically harming some of California’s most vulnerable residents—the state’s youth.
The new report highlights the fact that 90% of newly unemployed Californians over the past year and a half are under the age of 35 with the hardest hit group being teenagers. “This loss of youth work opportunity carries with it real long-run harm,” said Christopher Thornberg, Founding Partner of Beacon Economics and co-author of the new analysis. “It not only denies younger workers a critical source of income it deprives them of work experience that has been empirically shown to improve their chances of long-run success.”
While the recent rise in unemployment in California has occurred in tandem with the state’s minimum wage hikes, the relationship likely extends beyond mere correlation. According to the analysis, the jump in unemployment is incongruous with other measures of the California economy, which have continued to expand at a respectable rate. In fact, both output and household income in the state are robust and growing either faster than or similar to the nation overall. Yet, the unemployment rate in the United States as a whole has barely budged in the past 24 months.
And there is yet another anomaly: throughout the recent rise in unemployment, there has been no corresponding increase in unemployment insurance claims. If laid off tech and entertainment industry workers were driving California’s higher unemployment rate, it would almost certainly be reflected, at least to some degree, in UI claims, according to the analysis.
“For far too long, researchers and advocates alike have held up the minimum wage as a harmless and effective policy remedy for poverty and income inequality, but it is neither of those things,” said Thornberg. “Evidence has shown us that minimum wages don’t do much to address the ills they are intended to correct, but carry a substantial cost, particularly for our state’s future workers.”
Although well intentioned, Thornberg, and co-author Niree Kodaverdian, argue that higher minimum wages cause prices to increase, which end up reducing real incomes for lower-skilled workers. Available data and past empirical studies show that wage floors do very little to divert income from higher income workers to lower income ones, which is how minimum wage laws are typically characterized by proponents.
The specific effect on youth is caused because as labor costs go up relative to other inputs, employers who might have used lower-skilled, entry level workers, such as teenagers, move towards hiring older, more experienced workers, according to the analysis. The idea is that if an employer is legally obligated to pay a higher wage, they will naturally hire more skilled and productive workers to offset higher labor costs. Since those under age 25 make up nearly half of minimum wage workers, this restructuring disproportionally affects the state’s youth.
The report firmly acknowledges the need for policies to help alleviate the strain on lower income households in pricey California but argues that this particular policy remedy doesn’t work as intended, and when pushed too far, can inflict real harm on some of the state’s most vulnerable residents. Better policy options, according to the authors, include the Earned Income Tax Credit, early childhood education, and increased training for lower-skilled adults.
The full analysis can be found here.
|
Business Journal Newsletter
|


-

 Sports Business6 months ago
Fontana’s Raymond Muratalla Defends IBF World Title in Las Vegas
-
 Sports Business4 months ago
Ontario Tower Buzzers and IE Chamber to Host Exclusive VIP Reception at New ONT Field
-

 Travel & Tourism3 months ago
Ontario International Airport passenger volumes rose for 4th straight month in March while freight shipments grew by 15%
-

 People On The Move3 months ago
Kaiser Permanente Appoints New Senior Vice President and Area Manager for San Bernardino County
-
 Executive Profile4 months ago
Pankow Builders Launches Pankow Wood Structures to Expand Mid-Rise Housing Capabilities
-

 Career & Workplace4 months ago
Jobs Dip, But Not Demand: Inland Empire Economy Shows Mixed Start to 2026