
Opinion
San Bernardino County Hotel Resilience is an Opportunity Zone Investment Opportunity
San Bernardino County (SBC) attracts millions of visitors and tourists every year. Despite a deadly global pandemic, rising political tension and an unpredictable stock market, SBC tourism has shown ongoing resilience compared to pre COVID-19 life. Interestingly, and given a healthy combination of business mix and ‘drive-to’ destinations, tourism in certain parts of SBC continued to grow despite the pandemic.

OPINION
By Sophia Thé — Guest Writer
San Bernardino County (SBC) attracts millions of visitors and tourists every year. Despite a deadly global pandemic, rising political tension and an unpredictable stock market, SBC tourism has shown ongoing resilience compared to pre COVID-19 life. Interestingly, and given a healthy combination of business mix and ‘drive-to’ destinations, tourism in certain parts of SBC continued to grow despite the pandemic.
As the largest county in the United States, San Bernardino County stretches across the golden state of California from the eastern border of Los Angeles County, through the mountains of Big Bear to the Mojave Desert. Its vast 20,000 mile area is spread across 24 diverse cities in the heart of southern California, and bordered by the states of Nevada and Arizona.
The County includes a balanced mix of leisure, business and group related tourism demand. On the transient side, national parks, music festivals, and destination resorts are coupled with a quickly growing business community that includes pandemic-resilient industries such as logistics, defense, and aerospace. Before the pandemic, Ontario International airport was one of the fastest growing airports in the nation by number of travelers.
Since the turn of the century, San Bernardino County has been growing exponentially in all sectors. Tourism spending reached $5.3 billion in 2018, employing over 55,500 workers, as indicated on the county website. Prior to the COVID-19 Pandemic, SBC hotels occupancy trailed Orange County and San Diego County by only 7% and 5%, respectively, as reported by Smith Travel Research (STR).
The Pandemic
The County provides a good example of how focused political leadership can drive positive results. The diversification of business, coupled with ‘drive-to’ accessibility of local resorts, and the strength of the logistics sector powered by the three international logistics airports continued to get ‘heads in beds’. Per STR, when compared to all other SoCal Counties, SBC closed 2020 as the leader in hotel occupancy at 59%, followed by its neighbor Riverside County at 50.8%. Total room revenue in SBC declined 21.5% from 2019, versus San Diego County and Los Angeles County where revenue decreased 53.7% and 52.6%, respectively. Interestingly, while occupancy decreased from 2019, total available room inventory increased by 0.7%.
Freddy Bi, Vice President of Sales and Marketing at Inland Empire Tourism Council, points to proactive local political leadership driving a healthy Chain Segment mix in San Bernardino County as a leading cause for business resilience: “Hotels in the Inland Empire are well positioned, with inventory that is in the economy to upper midscale hotel segments and limited inventory in upper upscale – which enabled the region to absorb the impacts of COVID-19.” Due to the industrial makeup of the region, unbelievable demand in manufacturing and logistics helped to sustain the market, and the reduction in corporate travel was quickly replaced by new demand to house frontline workers in response to COVID-19.”
The pandemic highlighted the unrivaled resilience of the hotel industry in SBC. Recent national press highlighted a consumer shift to outdoor drive-to destinations and, logically thinking, between Joshua Tree, Big Bear Lake, Lake Arrowhead, San Bernardino National Forest, and the Mojave National Preserve there are thousands of miles of fresh air and beautiful landscapes that attract both summer and winter clientele.
According to Visit California Data, from January 2020 to January 2021, customer demand for hotels in the Inland Empire only changed -4.1%, a very small decline when compared to areas like Los Angeles and Orange County that saw -43.5% and -58.6% decreases in hotel demand respectively. The average hotel demand decline in California during this time period is -41.5% These data reveal that not only is San Bernardino doing better, it’s also doing 37.4% better than the rest of the state.
Nevertheless, the reality is not uniform throughout the County. While some cities that depended on convention business saw a double-digit decrease in hotel revenue, STR reported Colton, Redlands, and Hesperia closing 2020 as the top performers with 7.1%, 3.4%, and 3% revenue increases from 2019. As an additional point of interest, Hesperia, a town located at the edge of the ‘mountain path’ and adjacent to Joshua Tree and the Mojave Desert, had its hotels increase Average Daily Rate (ADR) by over 7% from 2019. Even before the pandemic, the economy of Hesperia has been steadily increasing. Per DataUSA, from 2014 to 2018 there was a 17.3% increase in median household income in Hesperia, and a 21.3% increase in median home value. This is just one example of a local community that should be considered by investors given recent data.
Rhonesia Perry, Economic Development, County of San Bernardino and Board Chair for Inland Empire Tourism Council, is proud of the collaborative work that the County, the cities, hotel owners, and tourism stakeholders in the region: “It is a testament to the great community of professionals we have in our hotels and at venues throughout the county that the community was able to pivot and work together; as many individuals in the hospitality industry employed.” While we have a long way to recovery, the numbers speak for themselves on the long term potential that hotel owners and investors have in our region.”
Opportunity Zones
Coincidentally, or maybe not, all SBC cities that performed at or above 2019 hotel occupancy have a strong Opportunity Zone (OZ) presence, which introduces an even higher incentive for investor attraction. According to data provided by Esri, of the more than 2 million residents of SBC, over 330k live in OZs and have a median household income of $35.7k. Approximately 68% of the OZ population is Hispanic origin and 12% are Black, versus the general SBC population which is 55% Hispanic Origin and 8% Black. Another interesting metric is the population median age being 28 in the OZs, vs 33 in the larger County.
The county counts 57 qualified Opportunity Zones census tracts, spread throughout 15 cities and the unincorporated areas. In line with the general County, diversification is a recurring theme in the local OZs as well, with local industries such as cannabis and film production, in addition to world class medical research at Loma Linda and defense production in the high desert. Virgin Train, the Boring Company, Coca Cola, and Blackstone are just some of the companies that invest large checks in local opportunities.
The Future
The strength of the local real estate market coupled with a business friendly local government is assumed to result in increased future demand in hotel investment. Unlike many other markets, where the cost to build (replacement cost) per room could be above market average, San Bernardino may remain an attractive place for ground-up construction given the ongoing availability of undeveloped land and access to talented labor. Governor Newsom’s focus on California’s inland counties coupled with the long list of over 300 State and Federal incentives and loans for OZ projects will enable smart investors to leverage the current economy to invest in truly distressed communities, creating good hotel jobs while achieving attractive long-term financial returns.
Contributed by Sophia Thé, Local Equity, an Economic Development Organization specialized in Opportunity Zone Investments, Ontario, California.

Opinion
KTGY Announces Unanimous Approval of Community-Serving Shopping Center in North Redlands, California
KTGY’s design transforms an underutilized site into a neighborhood anchor and showcases Regency Centers’ commitment to the growing residential community
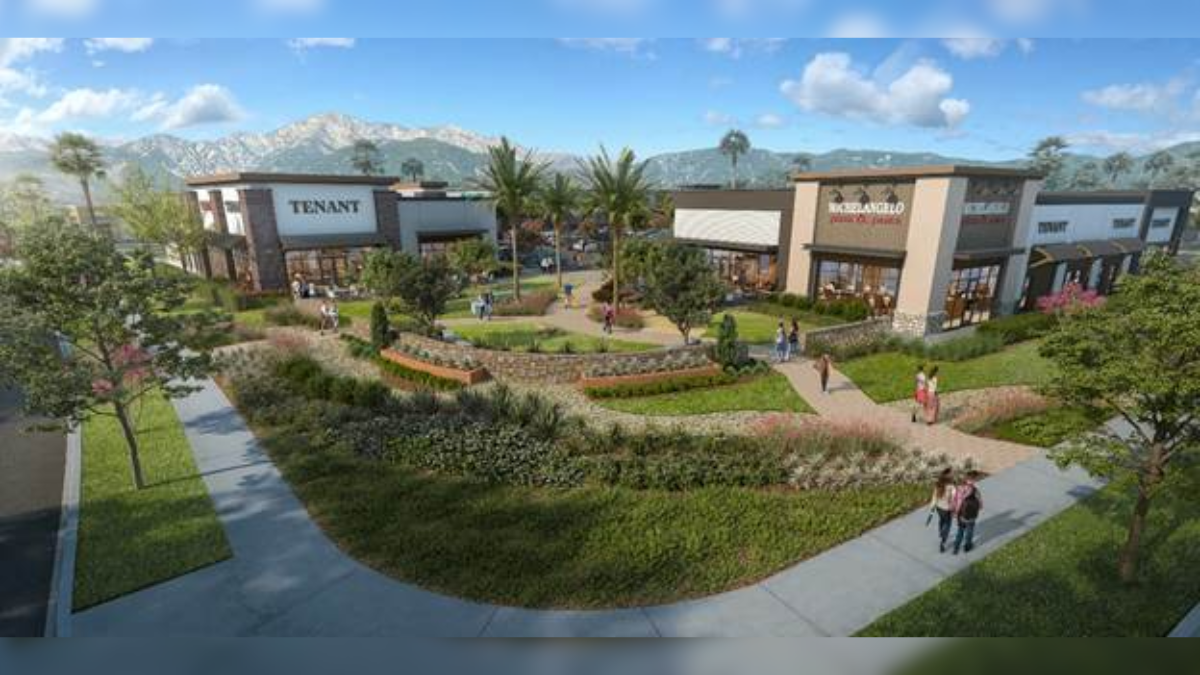
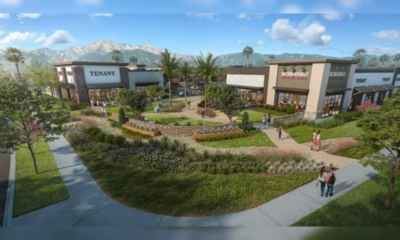
KTGY, an award-winning design firm focused on architecture, interior design, branded environments and urban design, announces that The Marketplace, a Whole Foods-anchored retail development designed for Regency Centers, received unanimous approval from the Redlands City Council on Feb. 17, 2026, clearing the way for the development to move forward to building permits and construction. Planned on an 8.18-acre vacant site at the northeast corner of Lugonia Avenue and Tennessee Street, the center sits in the heart of one of North Redlands’ fastest-growing residential areas.
The Marketplace is planned as a 71,400-square-foot neighborhood retail center anchored by Whole Foods and supported by four shop buildings and a dedicated drive-through pad. Designed to LEED Silver standards, the development reflects Regency Centers’ approach to placemaking, emphasizing retail environments that are authentic to their neighborhoods and foster long-term community connection. KTGY’s design reinforces and complements this vision through context-responsive architecture and a site plan shaped around community needs. The development transforms a long-underutilized site into a neighborhood anchor positioned to serve existing residents and new housing planned to the north and east.
“Working with KTGY and Whole Foods Market on The Marketplace has been a genuinely rewarding process,” said Ray Kayacan, vice president of investments at Regency Centers. “Redlands is a community that’s growing fast, and we’ve been intentional about making sure this development grows with it. Getting unanimous approval from the City Council speaks to the alignment we built with the city early on, and I think it reflects how well the full team executed against a shared vision.”
KTGY’s design team approached the site with the task of balancing client goals, tenant requirements and the needs of a future community while maximizing retail density and flexibility. The site’s proximity to the 210 freeway and its high parking requirements demanded a precise and efficient layout. KTGY allocated the required parking and EV stalls, utilized compact stall allowances and directed truck circulation around the site perimeter. The result is a finely tuned example of suburban retail that serves nearby neighborhoods, attracts customers off the freeway and creates a strong leasing environment for tenants.
The Marketplace is anchored by a 36,000-square-foot Whole Foods and organized around four retail buildings that can be flexibly divided into as many as 18 storefronts. A fifth pad building is planned for a drive-through use with its own dedicated circulation. Early concepts explored a more industrial character, but to secure the grocery anchor, KTGY adapted the development’s aesthetics to align with Whole Foods’ contemporary brand requirements.
The final design features simple, contemporary building forms emphasized by brick columns and tower elements, with a connective brick treatment carried across the center. Roofline and material variations add visual interest, while industrial accents, including gooseneck lamps and standing seam metal awnings, reference the area’s historic context. The architecture incorporates cementitious siding, stone treatments at key corners and parapet-screened rooftop equipment, creating an earthy, warm palette that responds to the surrounding neighborhood.
“Redlands has a real sense of place, and that shaped how we thought about this project from the start,” said Kayacan. “With one major housing development underway and another planned nearby, this site had an obvious gap to fill. Residents are going to have a Whole Foods, flexible retail that can support a range of needs, and a place to gather.”
KTGY also shifted back-of-house functions and truck circulation away from the main parking field, raised the sidewalk and added a landscaped berm to buffer pedestrians from drive-through and freeway activity. A lighter entrance structure at the Whole Foods façade breaks up the flat roofline and creates space for outdoor seating, and the development is rounded out by landscaped buffers and a shaded corner plaza where neighbors can gather.
Buildings are arranged around the perimeter with parking in the center, creating a clear and efficient circulation pattern. The site includes five access points: two primary driveways from Lugonia Avenue and Tennessee Street, secondary entries from both streets and a connection to the Tennessee Village development to the north. The drive-through pad includes its own pocket of parking to support tenant operations.
Two major housing developments — Lugonia Village, with 541 homes, and Tennessee Village, with 460 apartments and commercial space — were approved nearby in 2024, reinforcing the need for neighborhood-serving retail in this corridor.
“Our team approached this site with a focus on maximizing retail density and creating flexible space that can support a range of tenants while meeting the needs of the city, Regency Centers and both existing and future residents,” said Brandon Wernli, associate principal at KTGY. “Balancing a tight site, high parking requirements and a late-stage design shift to meet Whole Foods’ brand standards required precision. The result is a contemporary retail environment that reflects Regency Centers’ commitment to creating neighborhood-serving places that connect with surrounding communities.”
“This development fills a meaningful gap in the built environment,” Wernli said. “With new housing planned nearby, The Marketplace will serve as a neighborhood anchor and a convenient place to shop, dine and gather. It’s a strong example of how thoughtful design can elevate everyday community experiences.”
Construction is expected to begin in late 2026, with completion anticipated in 2028.
Opinion
Ontario International Airport Welcomes Avelo Airlines with New Nonstop Service to Sonoma County

Expansion Connects Southern California Travelers to Northern California’s Premier Wine Destination
Ontario International Airport (ONT) continues its impressive growth trajectory with the recent announcement from Avelo Airlines about their exclusive nonstop service to Sonoma County and Northern California’s renowned wine country. Starting October 10, the service will operate twice weekly on Thursdays and Sundays, connecting travelers directly to the Charles M. Schulz Sonoma County Airport (STS).
Streamlined Travel Experience
Passengers choosing Ontario International Airport are set to benefit immensely, not just from the expanded destination choices but also from the significant time savings associated with flying out of ONT. Known for its convenience and efficiency, ONT offers a more relaxed and hassle-free travel experience compared to larger, more congested airports. The smaller scale and thoughtful layout of ONT allow passengers to navigate check-ins, security, and boarding processes much more quickly, reducing the stress often associated with air travel.
Local Impact and Convenience
“Atif Elkadi, Chief Executive Officer of the Ontario International Airport Authority, highlighted the benefits of the new service, stating, “We are thrilled to add Avelo Airlines to our family of air carriers as we continue to provide exciting new destinations and travel options for the millions of Southern Californians who have made ONT their airport of choice.”
ONT’s strategic location and accessibility play a crucial role in its popularity. Situated in the heart of Southern California’s Inland Empire, the airport is conveniently reachable for residents from San Bernardino to Riverside and the surrounding suburbs. The airport’s proximity to major freeways reduces travel time to the airport itself, which is a significant advantage for local residents and businesses.
Enhanced Access to Northern California
Andrew Levy, Founder and CEO of Avelo Airlines, expressed enthusiasm about the new route, saying, “We are thrilled to announce our new nonstop service from Ontario to the Bay Area/Sonoma County, offering travelers a convenient, reliable, and affordable way to one of the most beautiful and vibrant regions in Northern California.”
Jon Stout, STS Airport Manager, also noted the mutual benefits of the new connection, “It’s fantastic to see Avelo connect Sonoma County with Ontario. This new route will bring a new level of convenience for our local residents and our neighbors in the Inland Empire.”
ONT’s continued expansion and the addition of new routes like the one to Sonoma County reflect its role as a pivotal hub in the region. With the airport on track to exceed 7 million passengers this year and recent records showing more than 650,000 passengers in June alone, ONT is setting new benchmarks in serving the community.
A Gateway to Growth
With world-class facilities and a commitment to excellent customer service, Ontario International Airport is rapidly becoming the gateway of choice for travelers seeking both domestic and international connections. Elkadi proudly asserts, “With our world-class facilities, great amenities, and unparalleled customer experiences, we are proud to connect the world to one of the most dynamic population and economic centers in the country.”
As ONT continues to expand its services and streamline travel experiences, it solidifies its position not just as a transport hub but as a significant contributor to the economic vitality of the Inland Empire.

“We have to stop touting the minimum wage as a completely harmless policy, or as some kind of remedy for poverty and income inequality… it is neither.”
In the past 18 months, California’s unemployment rate has jumped to the highest in the nation and a new analysis by Beacon Economics suggests that this peculiar increase could be a direct result of the state’s recent minimum wage hikes. Most concerning, according to the report, is that the current unemployment effect is specifically harming some of California’s most vulnerable residents—the state’s youth.
The new report highlights the fact that 90% of newly unemployed Californians over the past year and a half are under the age of 35 with the hardest hit group being teenagers. “This loss of youth work opportunity carries with it real long-run harm,” said Christopher Thornberg, Founding Partner of Beacon Economics and co-author of the new analysis. “It not only denies younger workers a critical source of income it deprives them of work experience that has been empirically shown to improve their chances of long-run success.”
While the recent rise in unemployment in California has occurred in tandem with the state’s minimum wage hikes, the relationship likely extends beyond mere correlation. According to the analysis, the jump in unemployment is incongruous with other measures of the California economy, which have continued to expand at a respectable rate. In fact, both output and household income in the state are robust and growing either faster than or similar to the nation overall. Yet, the unemployment rate in the United States as a whole has barely budged in the past 24 months.
And there is yet another anomaly: throughout the recent rise in unemployment, there has been no corresponding increase in unemployment insurance claims. If laid off tech and entertainment industry workers were driving California’s higher unemployment rate, it would almost certainly be reflected, at least to some degree, in UI claims, according to the analysis.
“For far too long, researchers and advocates alike have held up the minimum wage as a harmless and effective policy remedy for poverty and income inequality, but it is neither of those things,” said Thornberg. “Evidence has shown us that minimum wages don’t do much to address the ills they are intended to correct, but carry a substantial cost, particularly for our state’s future workers.”
Although well intentioned, Thornberg, and co-author Niree Kodaverdian, argue that higher minimum wages cause prices to increase, which end up reducing real incomes for lower-skilled workers. Available data and past empirical studies show that wage floors do very little to divert income from higher income workers to lower income ones, which is how minimum wage laws are typically characterized by proponents.
The specific effect on youth is caused because as labor costs go up relative to other inputs, employers who might have used lower-skilled, entry level workers, such as teenagers, move towards hiring older, more experienced workers, according to the analysis. The idea is that if an employer is legally obligated to pay a higher wage, they will naturally hire more skilled and productive workers to offset higher labor costs. Since those under age 25 make up nearly half of minimum wage workers, this restructuring disproportionally affects the state’s youth.
The report firmly acknowledges the need for policies to help alleviate the strain on lower income households in pricey California but argues that this particular policy remedy doesn’t work as intended, and when pushed too far, can inflict real harm on some of the state’s most vulnerable residents. Better policy options, according to the authors, include the Earned Income Tax Credit, early childhood education, and increased training for lower-skilled adults.
The full analysis can be found here.
|
Business Journal Newsletter
|


-

 Sports Business4 months ago
Ontario Tower Buzzers and IE Chamber to Host Exclusive VIP Reception at New ONT Field
-

 Travel & Tourism3 months ago
Ontario International Airport passenger volumes rose for 4th straight month in March while freight shipments grew by 15%
-

 People On The Move4 months ago
Kaiser Permanente Appoints New Senior Vice President and Area Manager for San Bernardino County
-

 Executive Profile5 months ago
Pankow Builders Launches Pankow Wood Structures to Expand Mid-Rise Housing Capabilities
-

 Career & Workplace4 months ago
Jobs Dip, But Not Demand: Inland Empire Economy Shows Mixed Start to 2026
-
 Opinion3 months ago
KTGY Announces Unanimous Approval of Community-Serving Shopping Center in North Redlands, California