
Opinion
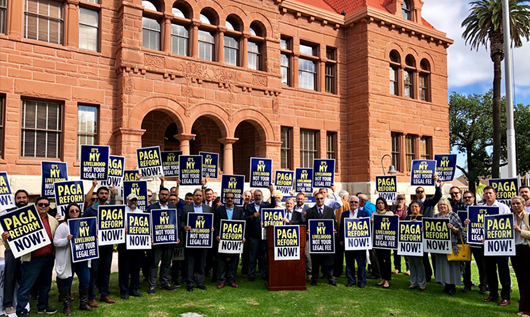
Abuse of PAGA leads to Lawsuit
By TOM MANZO | President of the California Business & Industrial Alliance
Dec. 19, 2018
The Private Attorney General Act (PAGA) was signed into law in 2003 by Gray Davis and championed by Senator Joe Dunn. Davis spent 1,778 days as governor and signed 5,132 bills into law and that is an average of 2.89 bills a day. PAGA was approved by Governor Gray Davis on October 12, 2003, just five days after the California electorate voted to recall him from office.
If you are not familiar with PAGA, this law deputizes each and every California employee (and his or her private contingency-fee attorneys) to sue their employers on behalf of the State. The California Labor Laws are composed of myriad rules, standards, and obligations, which touch nearly every aspect of the employment relationship. Many of the California Labor Laws are unclear, cumbersome, counter intuitive and impossible to follow. It is no wonder as the California Labor Law Digest published by the Chamber is over 1,100 pages.
If you are take your lunch later than 5 hours, even a second, it is a violation, or a gift card for the holidays is not put into the overtime rate is a violation. Do you have proper commission agreements? Third break after 10 hours or waived lunch? The list of potential traps just keeps going and it is impossible to follow all of these regulations and many are not appropriate for some industries. The Labor Laws cannot be a one size fits all and I think the only ones who understand these complex laws are the trial attorneys suing businesses daily.
Since this law was enacted over 35,000 PAGA notices have been sent out by the state and most turn into class action lawsuits costing employers millions. PAGA is used by the trial lawyers to start the process and many times settlement amounts going to the state are negotiated in mediation. As a matter of fact what is supposed to go to the aggrieved employees is also negotiated in mediation and what are not negotiable are the trial attorney’s fees thanks to the state.
An employee alleges (without any proof) that for the past year, he has worked 2 minutes of “of-the-c1ock” overtime each pay period attending to miscellaneous tasks related to opening or closing Employer’s place of business. Under the Starbucks decision, discussed supra, the employee has a cognizable claim of failure to pay minimum wages and overtime. Employer has 30 employees and weekly pay periods. Employee’s hourly rate of pay is $ 11.00 per hour, which means the approximate amount of unpaid minimum wages is: $19.07 (2 minutes x 52 pay periods: 104 minutes; 104 minutes / 60 minutes: 1.73 hours; 1.73 hours x $11.00: $19.07), and the approximate amount of unpaid overtime wages are: $9.54 ($19.07 x. 0.5: $ 9.54). So the total approximate amount of wages Employer failed to pay Employee, unknowingly, is $28.61.
Through PAGA, this employee has authority to seek a maximum of $69,508.61 civil penalties and personal damages for the alleged failure of Employer to pay Employee: $28.61, which are 2,430 times the alleged actual damages. With 30 employees your exposure is over 2 million dollars and this does not include employees no longer working for you. Those employees are owed 30 days’ pay and waiting time penalties.
What happens next is where things really go wrong as this employee will never see $ 69,000. All of that is done in negotiations behind closed doors. That Starbucks employee received a check for less than $ 700 and the rest goes to the trial lawyer and the state.
Our organization The California Business & Industrial Alliance filed suit against the State of California on November 28th of this year challenging its constitutionality. The complaint is 54 pages spelling out how this law began and where we are at today. It is time business owners, community leaders, legislators, all learned more about how badly this law is abused and helped facilitate real reform. Employers and employees both lose when it comes to PAGA.
The views expressed above are those of the author and do not necessarily reflect those of the Inland Empire Business Journal.


Opinion
KTGY Announces Unanimous Approval of Community-Serving Shopping Center in North Redlands, California

KTGY’s design transforms an underutilized site into a neighborhood anchor and showcases Regency Centers’ commitment to the growing residential community
KTGY, an award-winning design firm focused on architecture, interior design, branded environments and urban design, announces that The Marketplace, a Whole Foods-anchored retail development designed for Regency Centers, received unanimous approval from the Redlands City Council on Feb. 17, 2026, clearing the way for the development to move forward to building permits and construction. Planned on an 8.18-acre vacant site at the northeast corner of Lugonia Avenue and Tennessee Street, the center sits in the heart of one of North Redlands’ fastest-growing residential areas.
The Marketplace is planned as a 71,400-square-foot neighborhood retail center anchored by Whole Foods and supported by four shop buildings and a dedicated drive-through pad. Designed to LEED Silver standards, the development reflects Regency Centers’ approach to placemaking, emphasizing retail environments that are authentic to their neighborhoods and foster long-term community connection. KTGY’s design reinforces and complements this vision through context-responsive architecture and a site plan shaped around community needs. The development transforms a long-underutilized site into a neighborhood anchor positioned to serve existing residents and new housing planned to the north and east.
“Working with KTGY and Whole Foods Market on The Marketplace has been a genuinely rewarding process,” said Ray Kayacan, vice president of investments at Regency Centers. “Redlands is a community that’s growing fast, and we’ve been intentional about making sure this development grows with it. Getting unanimous approval from the City Council speaks to the alignment we built with the city early on, and I think it reflects how well the full team executed against a shared vision.”
KTGY’s design team approached the site with the task of balancing client goals, tenant requirements and the needs of a future community while maximizing retail density and flexibility. The site’s proximity to the 210 freeway and its high parking requirements demanded a precise and efficient layout. KTGY allocated the required parking and EV stalls, utilized compact stall allowances and directed truck circulation around the site perimeter. The result is a finely tuned example of suburban retail that serves nearby neighborhoods, attracts customers off the freeway and creates a strong leasing environment for tenants.
The Marketplace is anchored by a 36,000-square-foot Whole Foods and organized around four retail buildings that can be flexibly divided into as many as 18 storefronts. A fifth pad building is planned for a drive-through use with its own dedicated circulation. Early concepts explored a more industrial character, but to secure the grocery anchor, KTGY adapted the development’s aesthetics to align with Whole Foods’ contemporary brand requirements.
The final design features simple, contemporary building forms emphasized by brick columns and tower elements, with a connective brick treatment carried across the center. Roofline and material variations add visual interest, while industrial accents, including gooseneck lamps and standing seam metal awnings, reference the area’s historic context. The architecture incorporates cementitious siding, stone treatments at key corners and parapet-screened rooftop equipment, creating an earthy, warm palette that responds to the surrounding neighborhood.
“Redlands has a real sense of place, and that shaped how we thought about this project from the start,” said Kayacan. “With one major housing development underway and another planned nearby, this site had an obvious gap to fill. Residents are going to have a Whole Foods, flexible retail that can support a range of needs, and a place to gather.”
KTGY also shifted back-of-house functions and truck circulation away from the main parking field, raised the sidewalk and added a landscaped berm to buffer pedestrians from drive-through and freeway activity. A lighter entrance structure at the Whole Foods façade breaks up the flat roofline and creates space for outdoor seating, and the development is rounded out by landscaped buffers and a shaded corner plaza where neighbors can gather.
Buildings are arranged around the perimeter with parking in the center, creating a clear and efficient circulation pattern. The site includes five access points: two primary driveways from Lugonia Avenue and Tennessee Street, secondary entries from both streets and a connection to the Tennessee Village development to the north. The drive-through pad includes its own pocket of parking to support tenant operations.
Two major housing developments — Lugonia Village, with 541 homes, and Tennessee Village, with 460 apartments and commercial space — were approved nearby in 2024, reinforcing the need for neighborhood-serving retail in this corridor.
“Our team approached this site with a focus on maximizing retail density and creating flexible space that can support a range of tenants while meeting the needs of the city, Regency Centers and both existing and future residents,” said Brandon Wernli, associate principal at KTGY. “Balancing a tight site, high parking requirements and a late-stage design shift to meet Whole Foods’ brand standards required precision. The result is a contemporary retail environment that reflects Regency Centers’ commitment to creating neighborhood-serving places that connect with surrounding communities.”
“This development fills a meaningful gap in the built environment,” Wernli said. “With new housing planned nearby, The Marketplace will serve as a neighborhood anchor and a convenient place to shop, dine and gather. It’s a strong example of how thoughtful design can elevate everyday community experiences.”
Construction is expected to begin in late 2026, with completion anticipated in 2028.
Opinion
Ontario International Airport Welcomes Avelo Airlines with New Nonstop Service to Sonoma County

Expansion Connects Southern California Travelers to Northern California’s Premier Wine Destination
Ontario International Airport (ONT) continues its impressive growth trajectory with the recent announcement from Avelo Airlines about their exclusive nonstop service to Sonoma County and Northern California’s renowned wine country. Starting October 10, the service will operate twice weekly on Thursdays and Sundays, connecting travelers directly to the Charles M. Schulz Sonoma County Airport (STS).
Streamlined Travel Experience
Passengers choosing Ontario International Airport are set to benefit immensely, not just from the expanded destination choices but also from the significant time savings associated with flying out of ONT. Known for its convenience and efficiency, ONT offers a more relaxed and hassle-free travel experience compared to larger, more congested airports. The smaller scale and thoughtful layout of ONT allow passengers to navigate check-ins, security, and boarding processes much more quickly, reducing the stress often associated with air travel.
Local Impact and Convenience
“Atif Elkadi, Chief Executive Officer of the Ontario International Airport Authority, highlighted the benefits of the new service, stating, “We are thrilled to add Avelo Airlines to our family of air carriers as we continue to provide exciting new destinations and travel options for the millions of Southern Californians who have made ONT their airport of choice.”
ONT’s strategic location and accessibility play a crucial role in its popularity. Situated in the heart of Southern California’s Inland Empire, the airport is conveniently reachable for residents from San Bernardino to Riverside and the surrounding suburbs. The airport’s proximity to major freeways reduces travel time to the airport itself, which is a significant advantage for local residents and businesses.
Enhanced Access to Northern California
Andrew Levy, Founder and CEO of Avelo Airlines, expressed enthusiasm about the new route, saying, “We are thrilled to announce our new nonstop service from Ontario to the Bay Area/Sonoma County, offering travelers a convenient, reliable, and affordable way to one of the most beautiful and vibrant regions in Northern California.”
Jon Stout, STS Airport Manager, also noted the mutual benefits of the new connection, “It’s fantastic to see Avelo connect Sonoma County with Ontario. This new route will bring a new level of convenience for our local residents and our neighbors in the Inland Empire.”
ONT’s continued expansion and the addition of new routes like the one to Sonoma County reflect its role as a pivotal hub in the region. With the airport on track to exceed 7 million passengers this year and recent records showing more than 650,000 passengers in June alone, ONT is setting new benchmarks in serving the community.
A Gateway to Growth
With world-class facilities and a commitment to excellent customer service, Ontario International Airport is rapidly becoming the gateway of choice for travelers seeking both domestic and international connections. Elkadi proudly asserts, “With our world-class facilities, great amenities, and unparalleled customer experiences, we are proud to connect the world to one of the most dynamic population and economic centers in the country.”
As ONT continues to expand its services and streamline travel experiences, it solidifies its position not just as a transport hub but as a significant contributor to the economic vitality of the Inland Empire.

“We have to stop touting the minimum wage as a completely harmless policy, or as some kind of remedy for poverty and income inequality… it is neither.”
In the past 18 months, California’s unemployment rate has jumped to the highest in the nation and a new analysis by Beacon Economics suggests that this peculiar increase could be a direct result of the state’s recent minimum wage hikes. Most concerning, according to the report, is that the current unemployment effect is specifically harming some of California’s most vulnerable residents—the state’s youth.
The new report highlights the fact that 90% of newly unemployed Californians over the past year and a half are under the age of 35 with the hardest hit group being teenagers. “This loss of youth work opportunity carries with it real long-run harm,” said Christopher Thornberg, Founding Partner of Beacon Economics and co-author of the new analysis. “It not only denies younger workers a critical source of income it deprives them of work experience that has been empirically shown to improve their chances of long-run success.”
While the recent rise in unemployment in California has occurred in tandem with the state’s minimum wage hikes, the relationship likely extends beyond mere correlation. According to the analysis, the jump in unemployment is incongruous with other measures of the California economy, which have continued to expand at a respectable rate. In fact, both output and household income in the state are robust and growing either faster than or similar to the nation overall. Yet, the unemployment rate in the United States as a whole has barely budged in the past 24 months.
And there is yet another anomaly: throughout the recent rise in unemployment, there has been no corresponding increase in unemployment insurance claims. If laid off tech and entertainment industry workers were driving California’s higher unemployment rate, it would almost certainly be reflected, at least to some degree, in UI claims, according to the analysis.
“For far too long, researchers and advocates alike have held up the minimum wage as a harmless and effective policy remedy for poverty and income inequality, but it is neither of those things,” said Thornberg. “Evidence has shown us that minimum wages don’t do much to address the ills they are intended to correct, but carry a substantial cost, particularly for our state’s future workers.”
Although well intentioned, Thornberg, and co-author Niree Kodaverdian, argue that higher minimum wages cause prices to increase, which end up reducing real incomes for lower-skilled workers. Available data and past empirical studies show that wage floors do very little to divert income from higher income workers to lower income ones, which is how minimum wage laws are typically characterized by proponents.
The specific effect on youth is caused because as labor costs go up relative to other inputs, employers who might have used lower-skilled, entry level workers, such as teenagers, move towards hiring older, more experienced workers, according to the analysis. The idea is that if an employer is legally obligated to pay a higher wage, they will naturally hire more skilled and productive workers to offset higher labor costs. Since those under age 25 make up nearly half of minimum wage workers, this restructuring disproportionally affects the state’s youth.
The report firmly acknowledges the need for policies to help alleviate the strain on lower income households in pricey California but argues that this particular policy remedy doesn’t work as intended, and when pushed too far, can inflict real harm on some of the state’s most vulnerable residents. Better policy options, according to the authors, include the Earned Income Tax Credit, early childhood education, and increased training for lower-skilled adults.
The full analysis can be found here.
|
Business Journal Newsletter
|


-

 Sports Business6 months ago
Fontana’s Raymond Muratalla Defends IBF World Title in Las Vegas
-

 Sports Business4 months ago
Ontario Tower Buzzers and IE Chamber to Host Exclusive VIP Reception at New ONT Field
-

 Travel & Tourism3 months ago
Ontario International Airport passenger volumes rose for 4th straight month in March while freight shipments grew by 15%
-

 People On The Move3 months ago
Kaiser Permanente Appoints New Senior Vice President and Area Manager for San Bernardino County
-

 Executive Profile4 months ago
Pankow Builders Launches Pankow Wood Structures to Expand Mid-Rise Housing Capabilities
-

 Career & Workplace4 months ago
Jobs Dip, But Not Demand: Inland Empire Economy Shows Mixed Start to 2026